Running Data Expeditions in a context of low tech literacy.
How to be inclusive while driving social change initiatives involving data and technology? An example of bridging links and value every single voice
This saturday morning in the social center of the Chevaleret neighborhood located in the 13th district of Paris, a few inhabitants are timidly drinking a cup of coffee, while a team of social professionals are bustling around, a bit anxious, getting the place ready for the first data expedition of a serie of three, to come in the month of March and April in three neighborhood of Paris with high social priorities.
Context
In 2016, l’École des Données, the French School of Data team, has partnered with the Paris section of the Family Allocations Office, the CAF, standing for ‘Caisse des Allocations Familiales’. This government body in France, part of the French social security system, helps families by offering different services and benefits supporting different domain from early childhood, education, support to holidays for families who can’t afford it, family allowances, parenthood etc..
The partnership with School of Data takes place in a social policies improvement strategy for the Caf of Paris, who wished to understand and learn from both the experience of social workers from local organisations invested in a social mission, but also, and above all, the Caf wished to hold direct consultations with the inhabitants and the families who live in neighborhoods where an improvement of social services has been identified as a priority.
Parisian neighborhoods with high social public policies priorities :
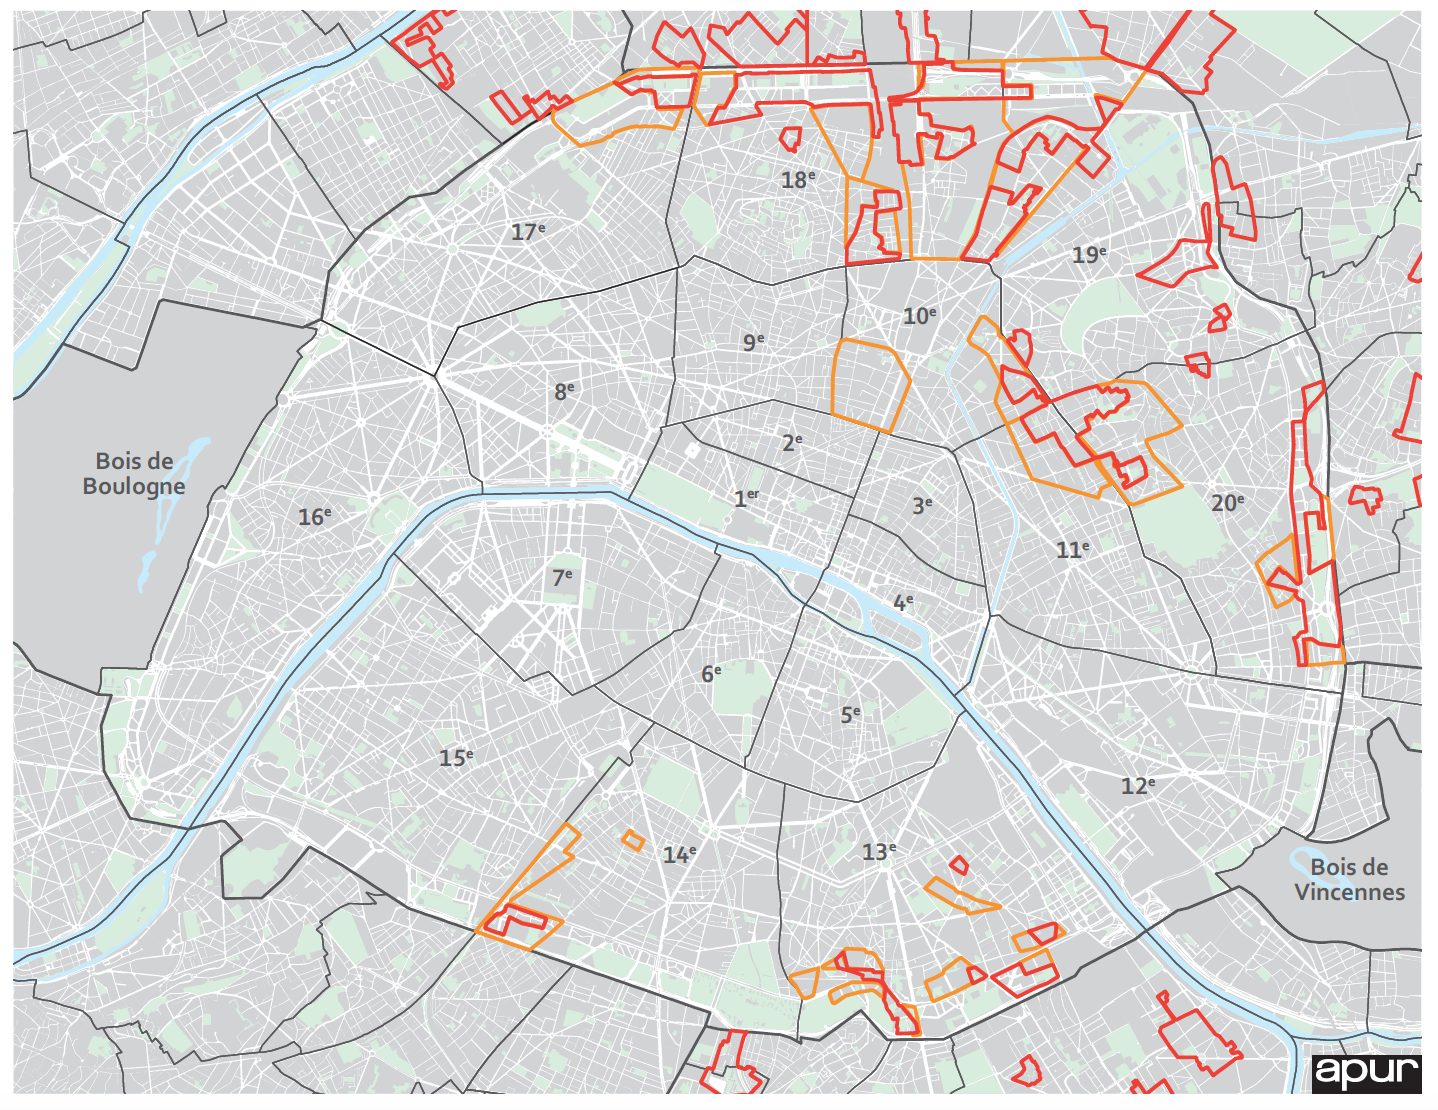
Two of the neighborhoods where School of Data conducted expeditions are part of this group. (ndlr : Possible to elaborate on the criteria that define such priority neighborhoods: unemployment rate, minimum revenue rate, .. )
The serie of three data expeditions were conducted in three different districts of Paris, and for each of them, a focus on a specific topic. The topics were decided by the Caf and their partners after a first diagnosis, and encompassed : access to rights and digital inclusion, parenting and parent-school relationships.
They took place all day from 10 am to 5 pm around four main activities: an introduction to data, open data, data vs information, conducted through a fact-checking workshop, a collective definition and comprehension of the topic in focus through the help of data, a debate around needs expression, and identifying potential improvements in regards of the existing social services publicly funded.
After several preparation meetings with the Caf coordination team, introducing the project to local social workers and organisations, it was established that the persons who would take part of the data expeditions would have a low tech literacy and a low access to digital devices.
1 - How to design activities to encourage people to participate on a topic they’re not familiar with ? The recipe : from the general context to the individual experience.
Before each data expedition, the objectives, outputs and outcomes were clearly defined by the Caf :
- Understand the people’s needs and priorities for each topic
- Identify the existing places where people go on a regular basis
- Identify potential developments or improvement in regard of the identified needs
The team of school of data built around those objectives a precise schedule and activities set, based on dialogue, conversations, oral ideations, allowing inhabitants to equally understand the purpose of each activity, and encourage their participation despite the skillset difference. It’s also important to note that some participants were not all too familiar with the French language, nor the ability to read or write fluently. Taking in account those parameters influenced how we introduced each activity.
In preparation of each data expedition, the school of data team collected :
- A list of open data sets related to the topic ( see our wiki )
- A list of datasets provided especially for the event by the Caf
- Documents, reports, desk research on the topic and produced an infographic to introduce basic facts on the neighborhood
A - A collective reflection to introduce the topic
This activity serves the objective of introducing the topic to the participants, and begin involving in a global reflection around dialogue and questions. This activity is based on desk research and provide facts or definitions that are presented as a basis to challenge them with personal experiences. Output : At the same time ideas are discussed, a documentation is being recorded and written in a paper board. This allows participants to visualise quantitatively the amount of responses or ideas that are collectively collected, as well as refer to them later when a more detailed reflection will be conducted.
B - Fact-checking
An infographic is produced and presented to the participants, they can have then a first interaction with data, facts they experience daily but presented in a single document in comparison with others. For example, it could be socio demographic data explaining a certain situation (what’s the rate and number of families in this specific neighborhood, is it less or more than in other parisian neighborhoods? What’s the trend in terms of family structure, are there more monoparental families than in other places? How old are the children in average and what’s the prefered childcare in the district? Etc.
Participants can then discuss the veracity of the facts and exchange perceptions and points of view based on their experience, as well as suggest other sort of visualisations of analysis that would be relevant to interpret the topic.
See the fact checking infographic produced for the 2d data expedition on the topic of parenting > http://datactivi.st/CAF/factchecking.html
C - Expression and qualification of needs
This activity is the key activity of this serie of data expeditions by its incitation of favorising the debate by expressing personal opinions. It is designed to deepen the understanding of the participants’ needs by adding a personal value to each of them. Each person is then encouraged to express their personal opinion by rating an importance scale for example so the output is a group overview of the priorities of needs when we dealt with parenting needs, or by rating their confidence towards a certain number of skills and capabilities that are needed to achieve a public service online, when we worked on the topic of digital inclusion.
Using color post-its and plot them on a grid creates a basis for debate.

And it can be reused in a digital form which will look like this :

D - Mapping the existing public service offer per topic in each neighborhood
The purpose of this activity is to locate existing services listed online in public portals, as well as identify other places, and offer at the end of the day, to both the general public and specifically to the participants an updated version of the map. The School of Data team prepared a few maps in advance and printed them as posters to stick on the walls during the data expedition. The activity consists then in distributing to the participants empty cards to fill with information about new locations. The data schema is defined in advance
An Introduction to data, data vs information and open data
A brief introduction to what is data, what is information, and how the two interact, is set at the very beginning of each data expedition, through an interactive game. This activity also serves as an icebreaker and is called: “ You’ve got 10 min to find 20 data”. The purpose of the game is that each participant has a limited amount of time (could be 5 or 10 min.) to collect 10 (or more) “data” around the room. This activity can also be conducted a group activity, depending on the level of data literacy and group dynamics.
This activity helps to lay down the basics or what is data, to identify the differences between data and information, and to understand that data is all around us.
See a more detailed description in French about this activity.
Inclusive tools to encourage debate, structure and illustrate ideas
Addressing the objective to collect most effectively the inhabitant’s opinions and needs about the implementation of social public policies in their neighborhood, while confronting data and technology to an audience who is unfamiliar with the concept of open data forced the team of School of Data to rethink the way Data Expeditions could be driven :
Emphasize on group collective activities and oral to formalize ideas rather than isolate people in small groups, who are not used to this kind of exercise Use the collective production of a spectrogram to sort and ponderate ideas as a tool facilitating debate and discussion Avoid computers or laptops in order of not intimidating people who are not comfortable using screens or devices, and perceive them as objects creating difficulties and that they don’t understand. Avoid personal expression in post-it or public paper boards, in order to include participants who are not comfortable with the French language or with writing.